Power BI — Everything you need to know to get started
In summer 2015, Microsoft announced the Power BI reporting and analysis service for visualising and combining data from enterprises’ own systems, files, intranet, cloud services or, for example, various open data services. There are already more than 80 different types of data sources, and more are being developed all the time.
This article was originally published as early as May 2017, but has been revised in 2019 as well as 2021 to fully reflect the current Power BI product.
Contents:
Introduction
Self-Service BI
IT Managed Centralised and Controlled BI
Different user roles
Tools and work steps
Power BI Desktop
Power BI Service cloud service
Power BI Report Server
Pricing and licences
Where to find additional info?
A bit of ‘good to know’ history
Introduction
Power BI is suitable for both rapid ad-hoc type self-service reporting and more centralised and controlled business-led organisation-level reporting. For this reason, usage patterns vary significantly, and reports or broader reporting solutions can be implemented by very different individuals, from users to BI experts.
The reports are implemented using Power BI Desktop and are viewed by end-users by logging into the Power BI Service cloud service using a browser, mobile applications, embedded in the intranet or Office 365 products such as SharePoint, Teams, Dynamics or PowerApps. Embedding visuals on public websites is also possible. Reports can also be embedded in customised business applications by application developers. Instead of using the cloud service, reports can be shared using the local Power BI Report Server.
You can check out the visualised Power BI reports generated from open data. In addition, visit the list of public Power BI reports of Finnish organisations here.
Microsoft continues to actively develop Power BI and listens to users’ wishes. Development is open and anyone can propose ideas, vote for them and follow the progress of ideas on the idea forum.
Self-Service BI
Power BI allows data to be presented in various measures and interactive visuals and is ideal for self-service BI. The preparation of reports is therefore possible to be carried out even closer to the end users or by themselves. Due to its ease of use and affordable pricing, Power BI has become an important reporting and analysis tool for, for example, controllers and analysts.
Anyone can make prefabricated data models into new visualised reports with a short instruction, as they are easier and more intuitive to produce than creating pivot tables in Excel, for example. At best, a report page can be achieved in a few minutes, and because the visuals are interactive, data can easily be viewed from different angles and drilled into in different ways.
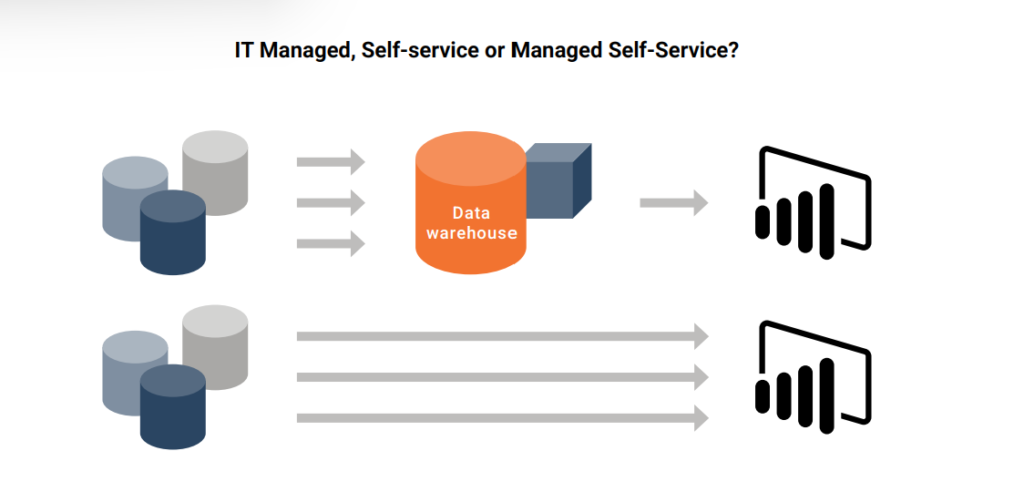
However, it is good to note that self-service BI can mean different things in different organisations and Power BI competence needs vary very much depending on the model:
- Business Led Self-Service BI
In a small organisation, self-service BI can mean reporting, for example, fully self-executed by the controller or financial manager, without the background support of IT. In this case, the data sources may be file-based, such as Excel or, for example, csv files “exported” from different systems, and the report creator does not have the opportunity to influence the structures of the data from the source system, but modification of the data to reportable format occurs in PBI Desktop queries. Such use requires diverse knowledge of PBI Desktop. Especially if the reports need to be combined with data from several different datasets. When Power BI was announced in 2015, users were initially self-service users, as initially Power BI’s features did not yet provide opportunities for more centralised IT-managed reporting. - IT Managed Self-Service BI
In a larger organisation, Power BI self-service BI can only mean preparing visuals and reports. In this case, IT centrally manages and maintains data warehouses, models and cubes and self-service users are not required to implement a data model or computational measures. In this case, the need for technical knowledge is substantially lower. - Self-service BI can also be a combination of the above, i.e. include elements of both, thus producing both self-service data models and utilising cubes provided by IT.
IT Managed Centralised and Controlled BI
Power BI’s role as an implementation tool or part of more centralised solutions has grown significantly over the previous years and Microsoft is currently developing Power BI’s enterprise features heavily.
In a centralised solution, it can be a mere visualisation tool if there is, for example, an SQL Server Analysis Server model in the background. It can also implement solutions similar to the Tabular models of the Analysis Server.
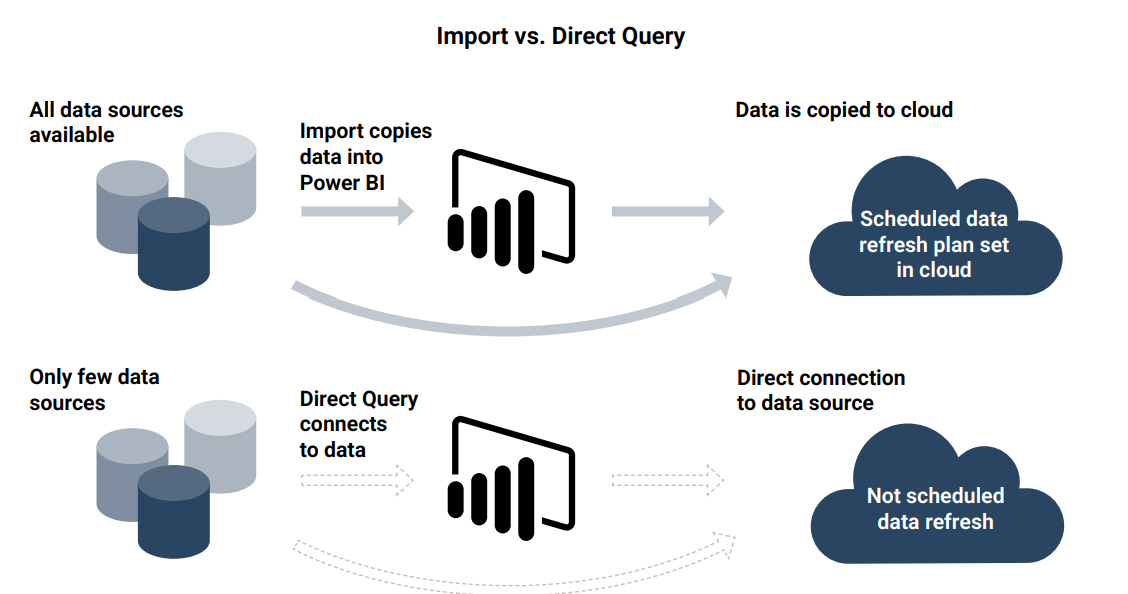
In wider use, it is important to design the practices and management model of Power BI reporting well to make the solution sustainable and maintainable. Power BI implementations also involve several architectural choices, such as copying data to Power BI and scheduling updates (import & scheduled refresh), or whether to use, for example, a real-time connection to databases or cubes (Direct Query, Live Connection). The choices are influenced by the amount of data or how up-to-date reports are needed.
The development of the product should therefore be actively monitored, as there continues to be major new features, such as the composite model announced in October 2018, which allows the combination of the above techniques, whereby part of the data in the data model is copied and part is directly connected.
Additional technical information can be found e.g. in Microsoft’s comprehensive white papers.
Different user roles
Power BI users can be divided into four different roles.
- BI developers, who usually implement solutions also on a variety of other tools, such as SQL Server Analysis Services, SQL Server Reporting Services, Cognos, etc.
- Technically oriented users, who also implement Power BI solutions, that is, create queries, implement data modelling such as combining tables, create computational formulas and measures in the DAX language. Such individuals work either on the business side or in the IT team.
- Creators of reports and dashboards, who know data well enough to be able to implement reports from existing models.
End users, who leverage reports and dashboards in the background of decision-making
Tools and work steps
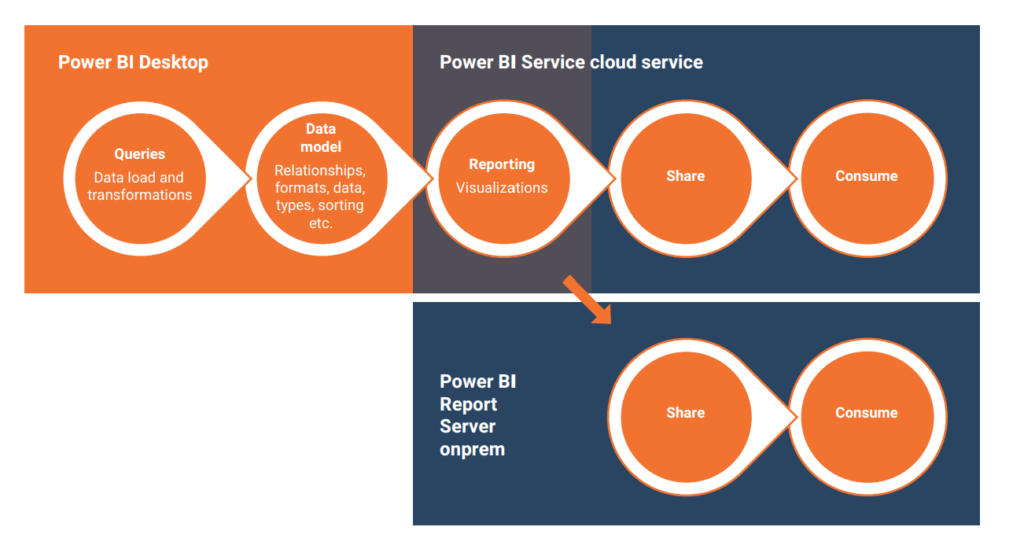
Queries, data modelling and calculation logic, and visuals are implemented using Power BI Desktop.
The formed files are published to either the Power BI Service cloud service or the Power BI Report Server in your data centre and distributed to end users for utilisation.
Power BI Desktop
Queries and data models are typically created by a person who is sufficiently familiar with the company’s information systems and data content, such as a BI expert, controller or analyst.
Simple data models consisting of a few tables can be made by anyone who understands, for example, the basic idea of relational databases or how the Excel VLOOKUP function works. If there is only one list to report, such as a view downloaded from a database or a single .csv file, hardly any knowledge is required.
The implementation of wider entities requires a good knowledge of relational databases and the basic principles of so-called dimensional modelling, as well as the opportunity to study the basic principles of the DAX language used in computing.
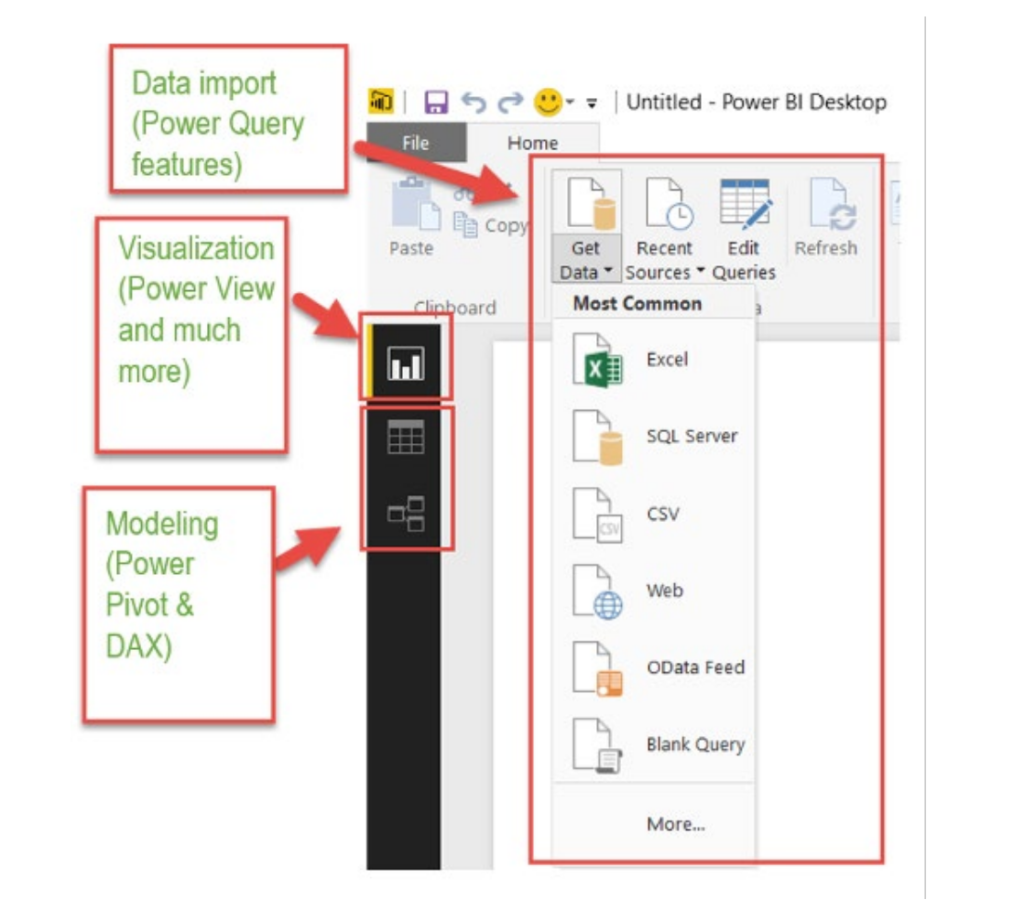
- Queries, i.e. data upload and editing, are done in the Power Query add-in in PBI Desktop. Power Query has hundreds of different transformation and modification possibilities, such as replacing decimal points with commas, splitting columns into sections, replacing a term with another, translating or grouping data in different ways, etc. The data editing capabilities of the query editor are really diverse.
- Creating a data model means linking the uploaded tables to each other based on a unique id, such as a customer number. Creating a data model also involves, for example, column formatting, assignment of sorting orders, and classifying fields as e.g. geographic data, so that data can be visualised as maps.
In addition, formulas called measures or calculated columns are added to the data model in the DAX language. In order for the solution to be easily maintained and extensible and support computation as well as possible, the model should be implemented as a so-called dimensional star model: Why data modelling is important in Power BI
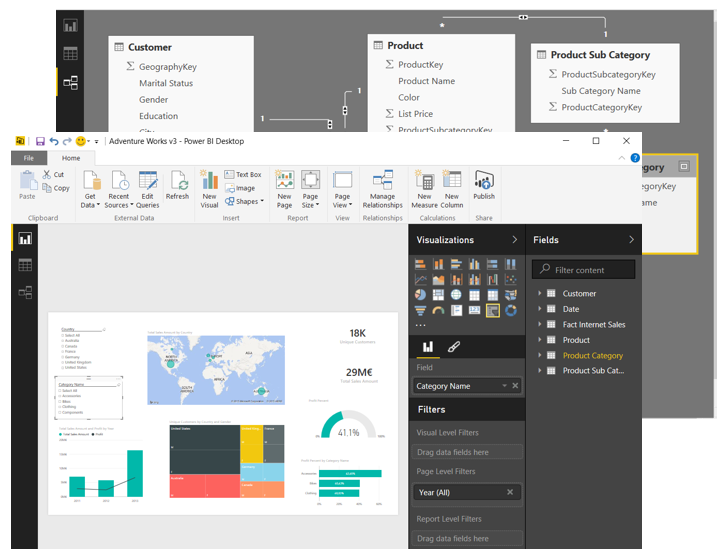
- Visualisation and reporting refers to the creation of report files and pages. Visuals are easy to create and report pages are automatically interactive, so a click on one column in a bar chart on a report page, for example, affects what is displayed in other visuals on the same report page.
In addition to Power BI’s built-in visuals, custom visuals can be uploaded to report files, and application developers can create more of them for different needs.
If Excel’s so-called Power tools are familiar, and you can compare different parts of PBI Desktop with them, since PBI Desktop has originated, that is, it has been implemented by combining add-ins that have been in use in Excel for a long time. These add-ins are alien to many Excel users, as you had to install them separately on top of older Excel versions.
- Power Query for creating queries, i.e. uploading and editing data to the appropriate format,
- Power Pivot fordata modelling, i.e. combining tables and adding the calculation logic as DAX formulas,
- Power View charts, which used to allow interactive visualisations in Excel, but the support for which has effectively been discontinued in Excel. In PBI Desktop, visuals have evolved considerably, so in the present day they can hardly be compared to Power View visuals other than in terms of a common interactive operating principle.
The same background technology and, for example, the computing language DAX is also used on the SQL Server Analysis Server when creating so-called Tabular models.
Although PBI Desktop has its roots in Excel, it has also been influenced by other reporting tools such as Tableau and Qlik. Admittedly, for several years now, Gartner has put Microsoft ahead of Tableau and Qlik in its reviews.
You can start exploring PBI Desktop by downloading and installing it either here or through the Microsoft Store, and reading these instructions: Getting Started with Power BI Desktop
Or by watching this video on YouTube
Power BI Service cloud service
If the cloud service is used as the method of distributing reports, models and/or reports implemented with PBI Desktop are published in workspaces, where the most important measures and visuals of the reports are compiled in dashboards.
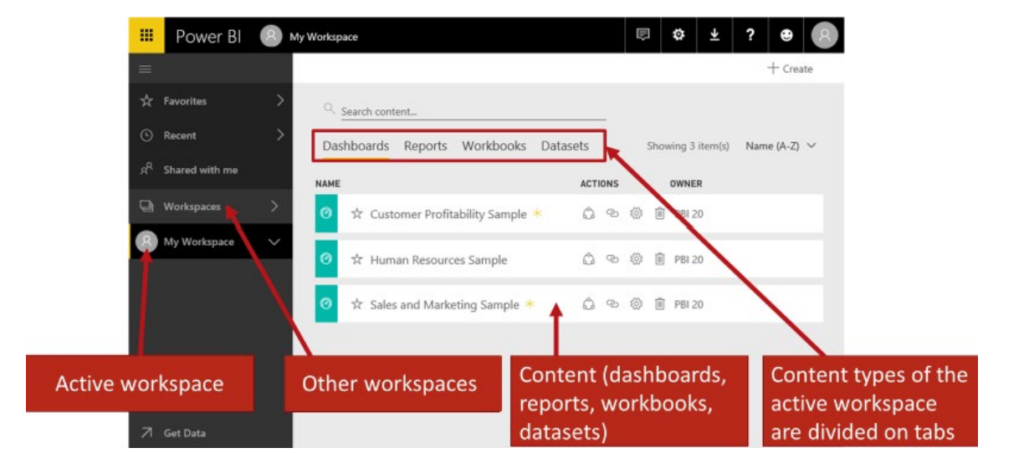
Workspaces are intended for report implementers and developers. Usually workspaces have only them as members. They distribute dashboards created in workspaces, as well as reports to other users, either individually or packaged into wider entities, known as apps.
If the cloud service is used, a single Power BI solution can be separated into two parts if desired:
- the technical part, “golden dataset“, which includes queries and the data model, and
- separate visualisation files connected by a live connection to technical model files.
In this way, the responsibility for implementing solutions can be shared with different individuals, and different individuals can form different report sets from centralised data models, for example for different target groups.
For example, in the cloud service, you can schedule data update automatically. Other of the most notable features of the cloud service are listed later in this article.
In the Power BI cloud service, the browser can also download data and implement reports, but the features are more limited compared to PBI Desktop. For example, queries and the data model created in PBI Desktop with computations cannot be modified in the cloud service. In practice, models and most of the reports are usually implemented in PBI Desktop.
Apps in the cloud service
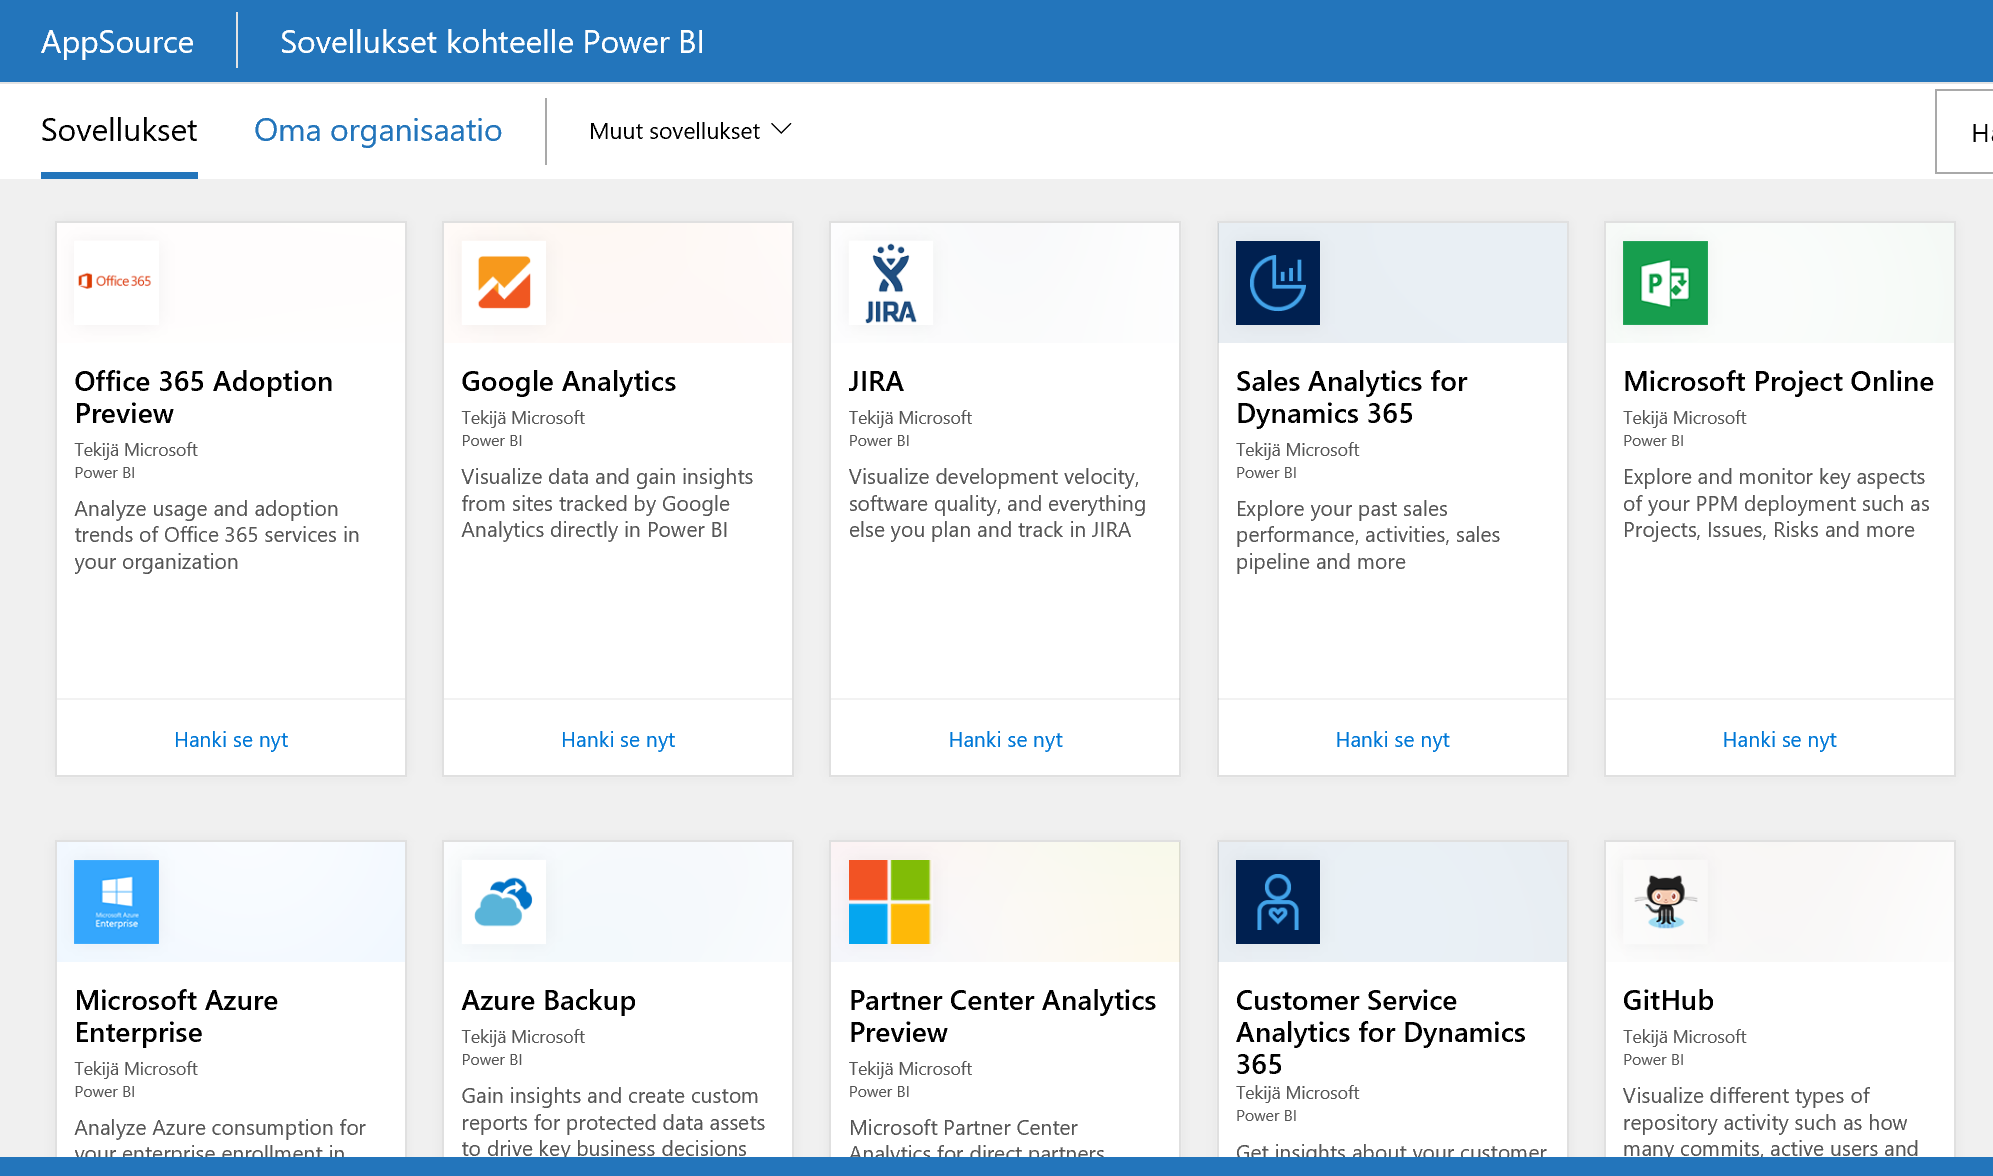
Power BI cloud service comes with a wide range of pre-built apps, previously called content packs, which allow users to easily analyse data from different cloud services such as Google Analytics, Salesforce, MailChimp, Dynamics CRM, Microsoft Project Online, etc.
These apps contain a ready-made data model with formulas, reports, and dashboards, so it is enough for the user to have an ID for the cloud app that they want to form reports on. Completed reports can be achieved with content packs in a few minutes.
Some apps are only available in the cloud service and cannot be modified in Power BI Desktop, which unfortunately means that you can mainly add reports to them, but the background technology cannot be modified.
Some apps are only available in the cloud service and cannot be modified in Power BI Desktop, which unfortunately means that you can mainly add reports to them, but the background technology cannot be modified. Some apps related to Microsoft’s own products are also available as PBI Desktop files, so you can build wider models and add your own computation and other data sources. Examples of this are Dynamics CRM packages that can be downloaded for your own use as PBI Desktop files.
The most essential features of the cloud service
The following is a list of essential cloud service features.
- Data update scheduler,
- Workspaces and collaboration with other developers (app workspace),
- Creating dashboards, i.e. collecting visuals into a single view from multiple reports,
- Easy ad-hoc type sharing of dashboards and reports to others,
- Packaging the organisation’s own report sets into apps and distribution of apps,
- Visualisation of real-time streamed data on dashboards (streaming dataset),
- Mobile access to reports and dashboards,
- Publishing and embedding reports publicly on the web,
- Embedding reports in SharePoint Online or other O365 applications such as Teams, Dynamics CRM or PowerApps,
- Embedding reports on non-SharePoint Online sites,
- Central utilisation of published datasets and implementation of report files in PBI Desktop,
- Implementation of Pivot table reports in Excel based on the Power BI model,
- Natural language queries in English such as “Sales by salesperson in 2019”,
- Ordering alerts to email when data is updated,
- Launching Flows when data is updated,
- Centralised implementation of queries, i.e. Dataflows.
For more information about the cloud service: Getting Started with Power BI Service.
Power BI Report Server
Power BI Report Server is available alongside Power BI cloud services so that Power BI implementations can be shared even without the cloud service in your data centre. Report Server is more limited than the cloud service, for example dashboards are missing and the Power BI solution cannot be divided into two parts (technology and visuals).
If the report server is used, you must use a version optimised for the server of PBI Desktop.
For more information: What is Power BI Report Server?
Pricing and licences
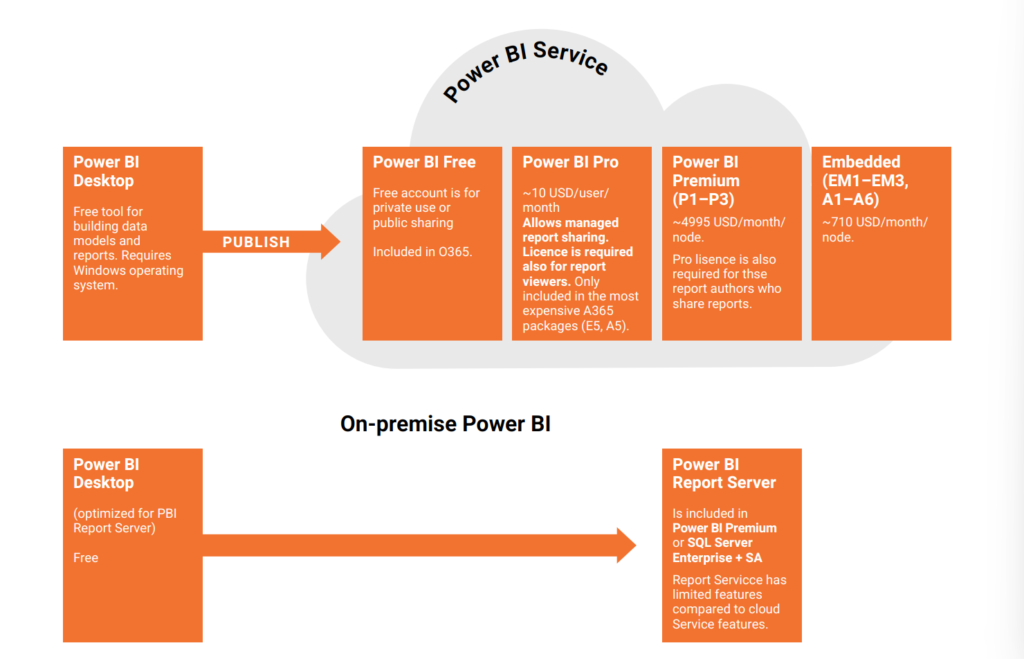
PBI Desktop is free and can be installed on any Windows workstation. However, PBI Desktop is not a tool for end users of reports, so either the cloud service, i.e. cloud licences or, alternatively, PBI Report Server is required.
There are five types of cloud service licences:
- Power BI Free
- Power BI Pro
- Power BI Premium Per User
- Power BI Premium (P1 – P3)
- Power BI Embedded (EM1-EM3, A1-A6)
You can check current prices on Microsoft’s website.
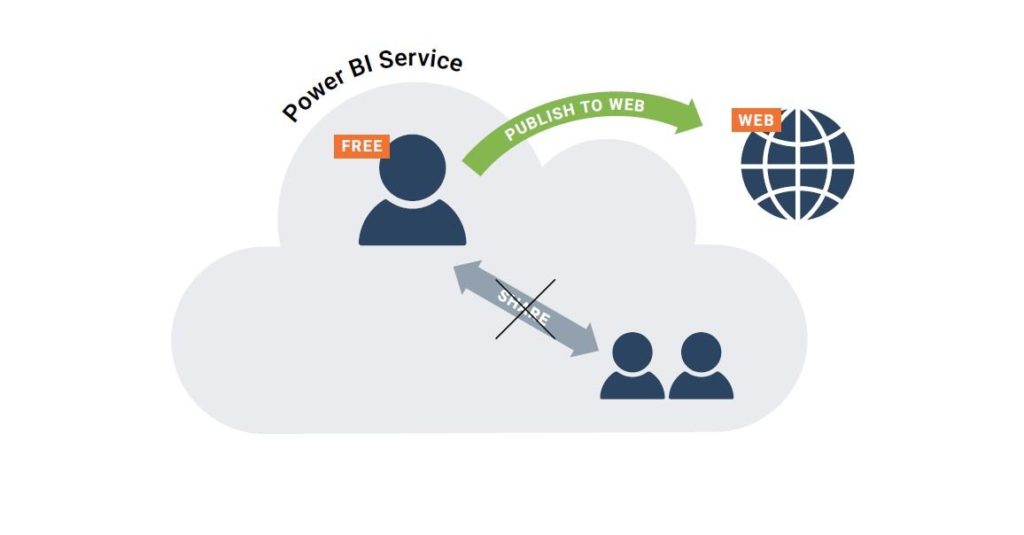
Power BI Free
The Power BI Free ID, or free licence, can be obtained through a business email by registering here. Free email addresses such as gmail.com or live.com are not valid for registration.
The Free ID is mainly intended for personal use and cannot be used to share reports with colleagues or read reports shared by others (unless the organisation has acquired a Premium capacity-based licence).
However, the Free ID allows for fully public sharing, which enables you to create a link for anyone to read the report. The ID can therefore be used, for example, in the implementation of fully public statistics.
It should be noted that almost all O365 packages include this PBI Free licence, but it does not allow reports to be shared within the organisation yet. It is often mistakenly thought that the Power BI icon displayed on O365 would provide full-fledged Power BI access. Distribution of reports and viewing them requires paid licences, which is described below.
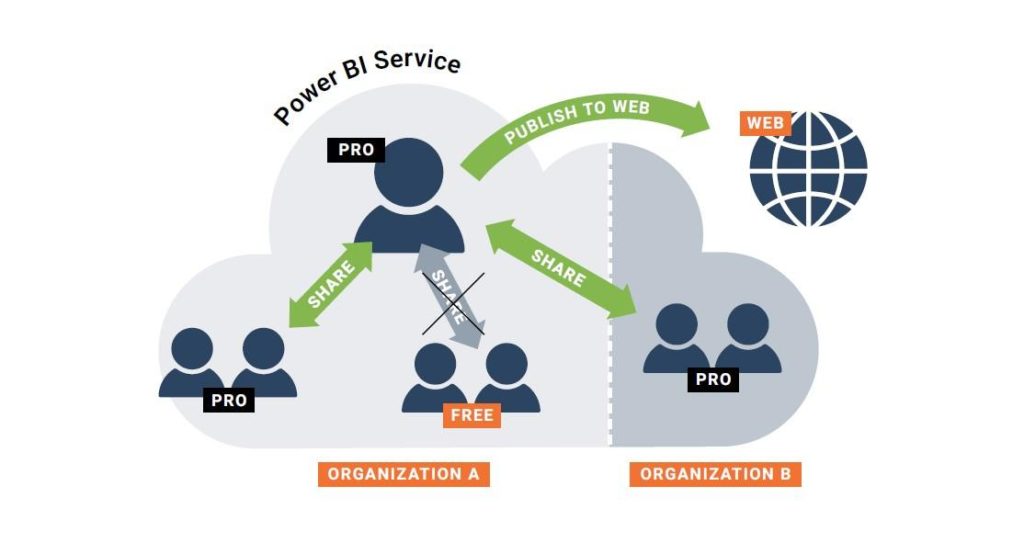
Power BI Pro
With Power BI Pro licences, reports can be shared with anyone who also has a Power BI Pro licence. In this licence model, the end users of the reports must therefore also have Pro licences. The administrator of the organisation can separately determine whether sharing to Pro users outside the organisation is also possible.
PBI Pro is included only in the most extensive O365 E5 package or the A5 package for educational institutions, so it does not need to be purchased separately for users. Otherwise, Pro licences must be purchased separately and can also be purchased even if the organisation does not use O365. The price of the Pro licence is around €8 per month per person.
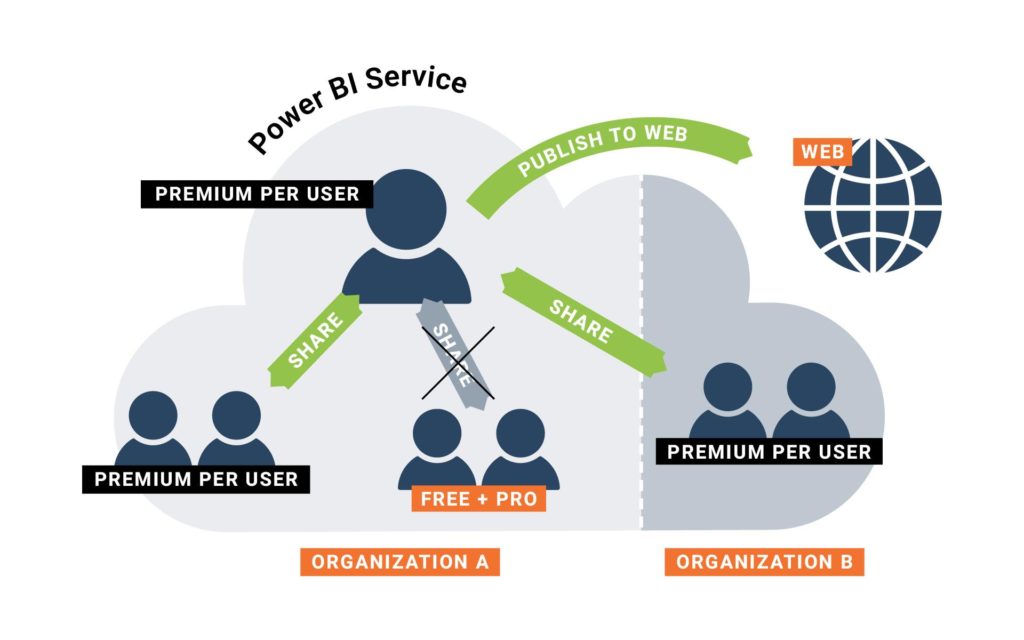
Power BI Premium Per User
The Power BI Premium Per User licence is a new licensing model introduced in April 2021 that offers additional Premium features with per-user licences compared to the Pro licence.
These features include a more frequent report update interval (up to 48 times a day), the ability to create paged reports, the ability to leverage AI on reports, and functionality for creating automated pdf prints from paged reports. A full list of all the differences between Pro and Premium functionality can be seen on Microsoft’s pricing page.
PBI Premium Per User is designed for organisations whose reporting needs need features that cannot be met by the Pro licence, but for whom capacity-based Premium licensing is too expensive an option. Premium Per User costs around €16 per month per user. If the user already has a Power BI Pro or O365 E5 licence, the Premium Per User can be obtained at around €8 per month.
With Premium Per User, it should be noted that this licence is required for both report creators and users who view Premium Per User reports. With a Pro licence alone, you will not be able to view reports that use Premium Per User features.
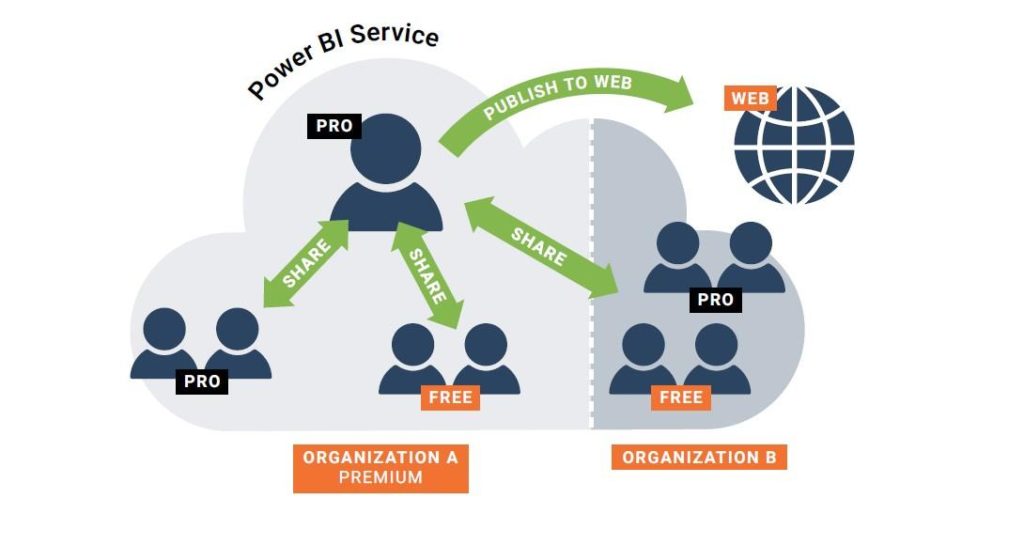
Power BI Premium
The Power BI Premium capacity-based licence is usually intended for larger organisations of over 500 people for which a per-user Pro or Premium Per User licence pricing would be quite expensive. Premium capacity is purchased in so-called nodes, and the price of one node is approximately €4,200 per month.
In the Premium licence model, personal Pro licences must only be purchased for those who implement and distribute reports to other users.
The pricing calculator allows you to estimate the price of a Premium licence in your organisation.
Power BI Embedded
With Pro and Premium licences, Power BI reports can be embedded on intranet sites as well as in O365 products (SharePoint Online, Dynamics, Teams, PowerApps), but in some scenarios, Pro and Premium licence costs would be high.
If you want to be able to carry out reporting, for example through a customer portal for a very large number of customers at a reasonable cost, it is possible to purchase a separate embedding licence.
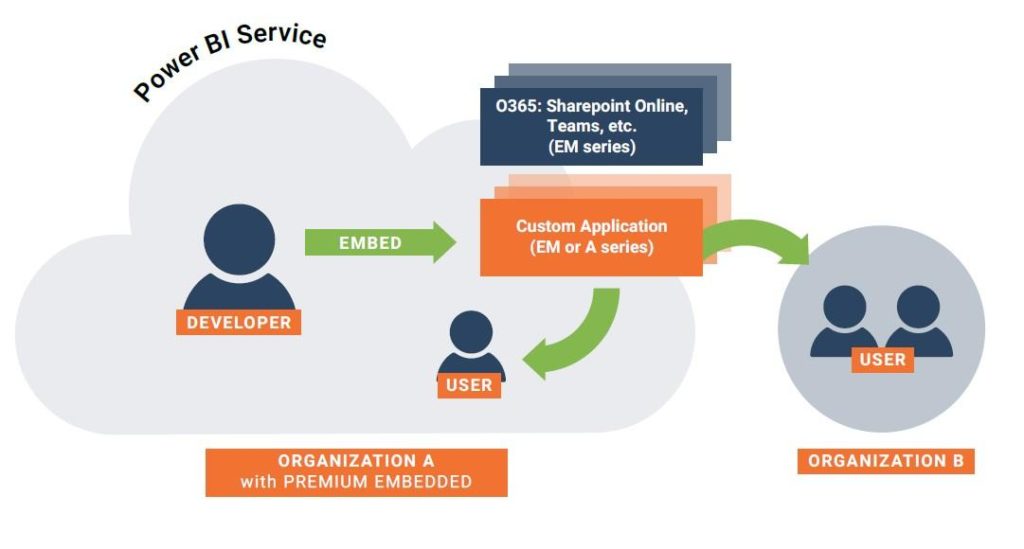
Power BI Embedded licences (A or EM series) allow you to share reports embedded within a self-coded application. With series A PBI Embedded (A1-A6) licences, Premium capacity is available starting at around €600 per month or even on a minute basis, as the service can be closed and started if necessary. Series A licences allow embedding only in custom applications (not O365 applications), as series A requires authentication to be self-encoded.
In addition, there is also an EM embedded licence series (EM1-EM3) to embed reports not only in custom applications, but also in O365 products (PowerApps, Teams, SharePoint Online, Dynamics), as EM licences allow the authentication of O365 to be used. EM series licences cannot be purchased by just anyone, meaning they are only available to volume licence customers.
EM prices also start at around €600 per month, as do series A licences, but you cannot use them on a minute basis by closing and starting the service as necessary.
Neither licence series (A or EM) allows reports to be viewed in the cloud service or mobile applications, i.e. they are only for embedding.
Power BI Report Server
The report server is not in itself a separate licence option as it is included in other licences, meaning it can be accessed either
- “for free” if the organisation holds an SQL Server Enterprise license and a Microsoft SA agreement, or
- by acquiring the previously mentioned Power BI Premium capacity licence with the possibility of using the cloud service also.
Do you want this guide in pdf format?

Where to find additional info?
Sulava organises both public and tailored trainings on Power BI themes, which have received excellent feedback:
- PL-900: Microsoft Power Platform Fundamentals – One day walkthrough of the main features of Power Apps, Power Automate and Power BI.
- PL-300: Microsoft Power BI Data Analyst – 3 day course where you learn how to analyze data with Microsoft Power BI and build reporting solutions.
- DP-500: Designing and Implementing Enterprise-Scale Analytics Solutions Using Microsoft Azure and Microsoft Power BI – Advanced 4 day course where students will use Microsoft Purview, Azure Synapse Analytics, and Power BI to build analytics solutions.
Sulava also implements and helps you implement Power BI solutions that you will be able to maintain and develop yourself.
Depending on your role, you should also familiarise yourself with this information:
- The ability to download custom visualisations for Power BI Desktop models,
- Power BI programmability,
- Enterprise features, such as the Gateway service needed for updates and direct query connections,
- Power BI Report Server.
A bit of ‘good to know’ history
When you start learning about Power BI it’s a good idea to know a bit of history, so you don’t end up reading completely outdated instructions or articles on the subject.
An earlier version of the product was called Power BI for Office 365 and could in practice be considered mainly a kind of pre-version. During its existence in 2014-2015, it never became widespread in Finland, and since the old and new service differ significantly, articles or instructions related to Power BI for Office 365 are no longer worth reading.
The reports of the old Power BI for Office 365 product were based on Power Pivot data models created with Excel, and reports were made either as Pivot tables or Power View charts and were published to Office 365. The new Power BI no longer requires Excel at all, or even necessarily an Office 365 licence. Reports are made using Power BI Desktop and are published to the Power BI cloud service, which can also be purchased without an existing Office 365 licence.
Although Excel no longer plays a key role at the heart of the product, Excel can still be an integral part of reporting, as
- for example, Excel files can be used as data sources,
- Excel’s Power Pivot data models can be converted to Power BI Desktop data models,
- Excel files can be displayed as such in Power BI among other reports, or
- Excel allows you to make Pivot reports from data models published in Power BI.
Power BI is based on the same technology that was originally used in Excel’s 2010 PowerPivot version and was called Vertipaq. Since then, its name was changed to xVelocity (in-memory analytics engine) and in addition to Excel, the technology was also introduced in 2012 in SQL Server Analysis Services Tabular models. Power BI uses the same DAX language as Power Pivot and SSAS Tabular models. This article has been previously published (in Finnish) on HExcelligent.
Contact us
sales@sulava.com
Text by Heidi Enho