Building a real-time, cloud-based monitoring solution using Power BI and Microsoft’s data offerings
You may have heard the saying “Data is the new oil”, which has been spreading around the last few years. This word “data” in this statement has usually referenced to the data that you and I leave behind when using technology, to be then made use of by advertisers, influencers, and other parties.
But just as well the data that your business generates is the new oil, which, if refined properly, will allow you to gain new and powerful insights into your business practices. This allows you to enhance, streamline and improve your business processes from research, development and manufacturing to sales, logistics and customer support. In this blog series I will go through a number of topics on how we can leverage Microsoft’s cloud-based business intelligence and data offerings to bring you new insights to your data.
Topics of this series:
1. Building a real-time, cloud-based monitoring solution using Power BI and Microsoft’s data offerings (this post)
2. Consolidating our enterprise data in the Azure Data Lake to enrich our data-driven solutions
Power BI is a powerful tool for building reports that allows you to gain new insights from your data. Often these reports are refreshed daily or even weekly, which can be enough for performing historical analysis on concerns such as sales performance, customer satisfaction or expenses.
However, Power BI can also be used to build reports that give you a clear look into what is going on in your organization right now, so that you can act on the information immediately. Such reports can display information from live manufacturing processes, logistics chains or even sales negotiations, all in real time.
By default, Power BI offers support for streaming and pushing real-time data. Both of these mechanisms allow us to easily build reports with live data, but they also come with some limitations: Streamed data is fast and powerful to use, but it can be stored at most for an hour, which limits its use only to monitoring live data. No historical analysis will be possible with streamed data.
Pushed data, on the other hand, will be stored by Power BI and it will support historical analysis. This makes it ideal for reporting scenarios where we can identify a set of real-time data that we need to make easily available for a single Power BI application. However, the downside to pushed data is that we cannot reuse the same dataset anywhere else. If we would like to create multiple reports using the same data, we would need to build separate pushed datasets for each of them – or come up with an alternate solution.
Case: Live industrial monitoring whiteboards with Power BI
Being aware of the technical options and limitations our tools give us is definitely important, but with data everything begins with identifying the data we have, where it comes from and what we want to do with it. In this case example we will be building industrial monitoring whiteboards, which are used to display lots of different kinds of data detailing the goings in our factory:
- Production speeds and targets
- State of the machinery: Temperatures, cleanliness, jams or any other issues
- Free storage space, inventory of parts and materials
- Environmental data: Outside temperatures, wind speed and direction
- Safety information: Number of accidents, latest notifications
Our production data is also timestamped, which allows us to attach it to the shifts working in the factory. This way we can not only see what is currently going on, but also see which teams have been performing beyond expectations. Next, we will classify our data based on how we need to use it on our reports:
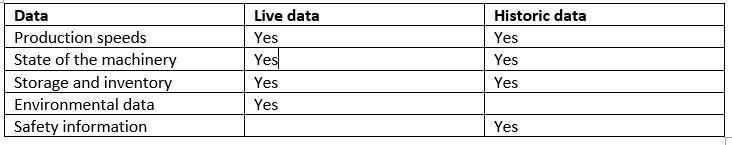
As you recall from before, with live data in Power BI our choices are to go with streaming or pushing data. We want to avoid pushing, because we have identified that there can multiple future use cases for data, and as such we want to store it in a more reusable place than a Power BI dataset. Streaming data is stored for an hour in Power BI, so we can use it to display immediate sensor information such as production speeds and temperatures, but we also need to capture them separately for historical analysis. This leads us to adopt a hybrid model with our data and reports.
In our hybrid model we will stream live data directly from our data sources to Power BI, where our BI developers create meters and real-time visuals for the data. The same data will also be captured into a SQL database, from where we will supply the reports with near real-time historic data.
To achieve this, we will use Power BI’s Direct Query method to fetch recent data (the last few factory shifts, perhaps) frequently. Power BI’s Import data method will then be used to fetch any data needed for longer historical analysis, such as analyzing factory teams’ performance over the year. A Power BI data gateway will be installed between the cloud-based Power BI service and our on-premises factory servers to facilitate data transfer.
Finally, once our data is in place and the reports have been developed, we still need to figure out how to display the reports to our end-users: Both the analysts viewing our historic data and the factory workers themselves.
Our analysts are likely to be happy to use the Power BI dashboard, and for their purposes it will work perfectly. For the factory workers, who are more reliant on the live data, out-of-the-box Power BI interface can be found lacking: It contains lots of visual clutter and controls that are on the way when the report is viewed from a factory hall monitor.
In addition, while the live streaming data is automatically refreshed in Power BI reports, our near real-time Direct Query data is only refreshed when the report updates – and by default Power BI reports update only every fifteen minutes. To circumvent this issue, we create a custom Power BI Embedded app, which allows us to minimize visual clutter and enforce report refresh times. In our factory we settle to have the report refresh the near real-time data once every minute.

With these high-level steps we have identified the data in our possession, developed use-case driven ways to capture and deliver it to Power BI and then created reports and ways to display them catered to our different users’ needs.
Do you feel like there might be ways in which your existing business data could be harnessed more effectively? Do get in touch and let’s see what we could do help you!